Skeptical science, for those of you who dont know, is a global warming blog which attempts to refute skeptic "myths." But the irony is they present many myths themselves when attacking skeptics opinions. One example is their post on the warming since 1998, in which they claim:
In truth, though, there has been global cooling since 1998, and even if you take 1998 out of the equation (the one that skeptical science needs to rebut the theory) we see there is still a decrease in global temperatures.
As the telegraph notes:
Skeptical sciences main concern, though, is that 1998 had a large warm spell so that any warming would look like cooling as the next year would inevitably have a cooler climate. So lets look at this claim. The 1998 explains the cooling/flat line. No it doesn't. Look at this NOAA graph:

http://climvis.ncdc.noaa.gov/cgi-bin/cag3/hr-display3.pl
By starting in 2000, it makes the 1998 warm spell objection invalid. And guess what we still see? cooling.
If we use data from 1998, though, it is obviously going to be more of a decline. but this rebuts the point of cherry picking the 1998 data as it shows cooling regardless of the El nino (how to you make then ene (squiggly)).
Now there are multiple satellite data sets we can look into. The reason satellite data is so essential is because surface scanner data is susceptible to the urban heat island effect. So before we can claim cooling, what does the satellite data say? Cooling.

Source 3
Even if we look past the 1998, we see an overall flat-line trend, statistically its essentially zero.
Now that the UAH data is out of the way, what about RSS? RSS and UAH combined makes this chart:
Source 3
When observing the facts, almost every data set shows either cooling or zero change in temperature in 1998. And the skeptical science rebuttal of El Nino hurting the results is false, as proven by NOAA data.[3]
Is the data bias?
Yes, these organizations support the AGW hypothesis and believe the earth is warming. Yet they get my conclusions. Fair enough?
[1] http://www.skepticalscience.com/global-warming-stopped-in-1998-intermediate.htm
[2] http://www.telegraph.co.uk/comment/personal-view/3624242/There-IS-a-problem-with-global-warming...-it-stopped-in-1998.html
[3] http://www.paulmacrae.com/?p=129
The planet has continued to accumulate heat since 1998 - global warming is still happening. Nevertheless, surface temperatures show much internal variability due to heat exchange between the ocean and atmosphere. 1998 was an unusually hot year due to a strong El Nino.[1]But is this claim really true? This claim is widely circulated, and in many skeptic blogs they usually get this response.
In truth, though, there has been global cooling since 1998, and even if you take 1998 out of the equation (the one that skeptical science needs to rebut the theory) we see there is still a decrease in global temperatures.
As the telegraph notes:
Consider the simple fact, drawn from the official temperature records of the Climate Research Unit at the University of East Anglia, that for the years 1998-2005 global average temperature did not increase (there was actually a slight decrease, though not at a rate that differs significantly from zero)[2]In other words, there is essentially a flat line in temperature.
Skeptical sciences main concern, though, is that 1998 had a large warm spell so that any warming would look like cooling as the next year would inevitably have a cooler climate. So lets look at this claim. The 1998 explains the cooling/flat line. No it doesn't. Look at this NOAA graph:
http://climvis.ncdc.noaa.gov/cgi-bin/cag3/hr-display3.pl
By starting in 2000, it makes the 1998 warm spell objection invalid. And guess what we still see? cooling.
If we use data from 1998, though, it is obviously going to be more of a decline. but this rebuts the point of cherry picking the 1998 data as it shows cooling regardless of the El nino (how to you make then ene (squiggly)).
Now there are multiple satellite data sets we can look into. The reason satellite data is so essential is because surface scanner data is susceptible to the urban heat island effect. So before we can claim cooling, what does the satellite data say? Cooling.
Source 3
Even if we look past the 1998, we see an overall flat-line trend, statistically its essentially zero.
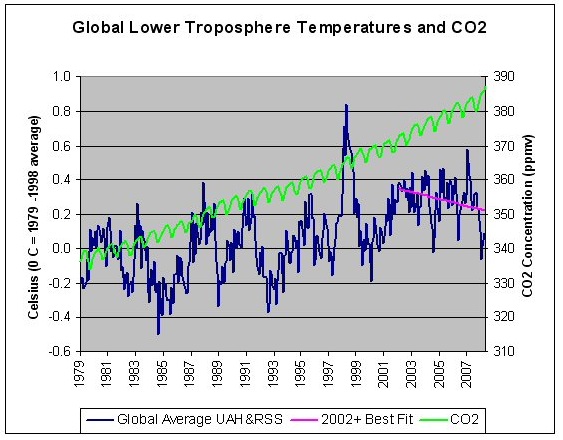
Now that the UAH data is out of the way, what about RSS? RSS and UAH combined makes this chart:
Source 3
When observing the facts, almost every data set shows either cooling or zero change in temperature in 1998. And the skeptical science rebuttal of El Nino hurting the results is false, as proven by NOAA data.[3]
Is the data bias?
Yes, these organizations support the AGW hypothesis and believe the earth is warming. Yet they get my conclusions. Fair enough?
[1] http://www.skepticalscience.com/global-warming-stopped-in-1998-intermediate.htm
[2] http://www.telegraph.co.uk/comment/personal-view/3624242/There-IS-a-problem-with-global-warming...-it-stopped-in-1998.html
[3] http://www.paulmacrae.com/?p=129
Hi Alexander, this is John Cook from Skeptical Science. Let me clarify some of the text you've excerpted from my site:
ReplyDelete"The planet has continued to accumulate heat since 1998"
What this means is our climate is still building up heat. More energy is coming in than is radiating back out to space. To properly see this, you need to look at measurements of the Earth's total heat content.
What this shows is a continued build up in heat into the last decade. So if the planet is still accumulating heat, what's happening with surface temperature? Why is the warming trend not as strong over the last couple of years? For the same reason why 1998 was so hot - ocean cycles. Just as the Pacific Ocean was in a strong El Nino phase in 1998, causing warmer temperatures, it has been in a La Nina phase over the last few years which has a cooling effect. So while the long-term global warming trend is driven by the planet's steady build up of heat, surface temperatures jump up and down from year to year as the ocean exchanges heat with the atmosphere. This is why scientists use long-term trends rather than short periods to determine what's happening to our climate.
Hello, Mr. Cook. I enjoy your site although I myself am more of a skeptic (I do believe, though, we have some influence on climate. Anyone who disagrees can't count "7 billion" people).
ReplyDeleteAnd your data relies on the fact we are the warmest decade, however a basis look at a graph can refute this. Look at my graph above (the last one). We see yes, the 2000s where hotter. However this does not mean the decade warmed. For example, if I added line like this "/", then on top of it put a flat line (or a slight decrease), it would still average out hotter then the upward line. Its fairly simple, and it refutes the idea we are warming within the last decade.
I counter the claim for El Nino in the post. To avoid the El Nino problem, I pushed the data forward to 2000. In other words, at that time (after the El Nino) controls for your rebuttal. Even when I use the 2000 data, we still see a decrease in temperature.
And your last point is long term trends. You believe humans have caused warming since 1975, correct? If so, then isn't less then 100 years time a short term trend? Climate is an ever changing thing, so your rebuttal to the time frame can be used to refute the whole AGW hypothesis.
Thanks for your input,
Alexander Adams.